
Published:
21 June 2018Reading time:
15 minWe’re very pleased to share this important report on the British Overseas territory of Bermuda, written by Bermudian economist Robert Stubbs, formerly Head of Research for Bank of Bermuda. There are more details on him and his work at the end of this fascinating and timely report. which we reproduce in full below. We’ve interviewed him on the Taxcast, our monthly podcast/radio show which you can listen to here.
Historically Britain encouraged the Overseas Territories to develop their finance sectors, which interact with, and benefit the City of London’s finance sector in all kinds of ways. We’ve long argued that the UK has a responsibility towards its Overseas Territories, to support them to progress towards economic diversification and tax reforms necessary in order to address inequality and boost their economies. (Bermuda’s government is currently working on new proposals which they’ll publish and debate in August 2018). Bermuda suffers, as does the UK, from what we call the ‘finance curse‘. In the same way that natural resources like oil can become a curse rather than a blessing for some states that produce them, an oversized finance sector can fail citizens in so many ways, and there are some fascinating comparisons here with other offshore centres, as well as evidence that demonstrates how “Bermuda’s income inequality has escalated to amongst the highest in the world”.
Inequality, Poverty and the Economic Imperative of Living Wages:
By These Measures, Just How Bad Are We?
Without question, the twin afflictions of extreme income inequality and mounting poverty are recognised as the defining economic and public policy challenges facing the world today. Far from being isolated to a few countries or a specific region of the world, these problems are acknowledged as now plaguing the vast majority of countries the world over.
Not surprisingly, the causes, consequences and potential remedies of extreme inequality and poverty have become the primary focus of researchers globally in recent years. Today, intensive research efforts extend well beyond departments of economics and business schools to encompass not only numerous other disciplines within academia but the resources and attention of private think-tanks, government agencies, supranational organisations and civil advocacy groups worldwide.
But what of these conditions in Bermuda today? Do we know how much Bermudians have endured as measured by these key economic dimensions? Do we have government estimates of their values? Do we know how Bermuda compares internationally in these crucial areas?
Regrettably, in Bermuda these statistics are notably conspicuous by their absence. To-date, the Bermuda Government has yet to produce an estimate of income inequality and an official measure of the island’s poverty was published only once from data as now long ago dated as 2004. When the subsequent fourteen years are occupied by an economic crisis of the scale and duration of our own, the elapsed period since our only official poverty reading represents an economic lifetime.
But while Bermuda has been preoccupied with avoiding the island’s harsh economic truths, much of the rest of the world has accumulated considerable knowledge of these twin maladies. Unsurprisingly, extreme income inequality leads to significant differences in health and educational outcomes and impedes social mobility, severely curtailing the life chances of the poor. As some will regard as patently obvious, high levels of poverty and inequality serve to squander the talent and thwart the potential of individual lives of the disadvantaged.
More recent research, however, exposes the detrimental impact of extreme inequality on economic growth for countries as a whole. Severe inequality not only harms the economic prospects of the poor, but the overall income generating potential of a country at the aggregate level as well. Moreover, severe inequality and poverty are mutually self-reinforcing. Extreme inequality inherently diminishes the poverty-reducing impact of economic growth and high levels of poverty reduce social mobility, leading to self-generating intergenerational cycles of privileged and disadvantaged families.
Additional work by political economists, political scientists and sociologists now also documents the malignant, politically corrosive nature of inequality extremes. As inequality rises, so too do the power and influence of financial and economic elites who invariably work to curry favour with politicians and regulators, subverting prudent reforms and entrenching further their unfair advantages.
If left unchecked, severe inequality inevitably leads to degenerative and potentially even dysfunctional governance. Democracy is seriously compromised, if not outright corrupted. At its most extreme, the money and power of elites result in what has been termed by researchers as a “political capture” of the political process or a “regulatory capture” of regulatory authorities who lose sight of the cares, concerns and, ultimately, welfare of ordinary citizens.
Perhaps most importantly, the research shows that neither inequality nor poverty is the ineluctable economic residual of capitalism’s inexorable march of progress. Quite to the contrary, extreme inequality and poverty are the direct consequences of poor public policy choices made by public officials. They are the results of choices we collectively make, or fail to make, and, as such, when properly understood, their solutions are eminently obtainable.
So, far from being a mere academic exercise in empirical economic estimation, quantifying Bermuda’s likely levels of inequality and poverty may well provide important insights in the political and regulatory conditions of the country in addition to our socioeconomic circumstances and could well offer critical preliminary guidance in the development of effective economic, political and regulatory reforms. To what degree has the island’s previous policymakers exercised poor judgement in their decision-making? If errors in policy have occurred, were some likely to be more damaging than others?
How has the island’s experience with inequality and poverty evolved over time? Can we point to changes in government policy predating significant changes in our inequality and poverty? Has Bermuda’s experience with policy adoption and our subsequent economic performance differed materially from those of other countries?
How alert should Bermudians be to the risk of political and regulatory capture of their authorities? Has the welfare of ordinary Bermudians been systemically subjugated to the interests of more powerful foreigners and wealthy Bermudian elites, and, if so, should institutional reforms be implemented to address these imbalances? And, now that Bermuda’s new government is purportedly poised to embark on historic reform, are we likely to encounter much resistance from our public and private sector guardians of Bermuda’s powerful financial and economic interests? Or, perhaps given the scale of Bermuda’s economic problems, does our new government even possess the requisite competencies to deliver on their promises?
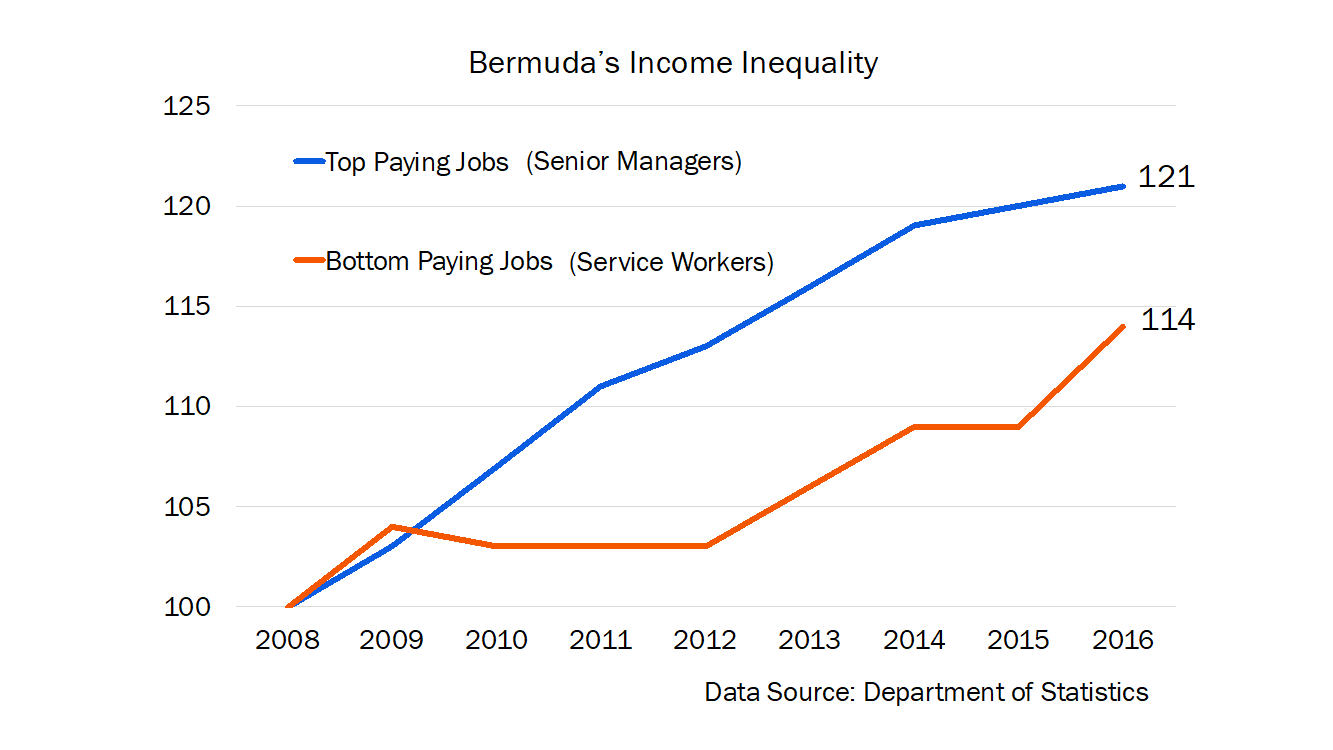
Turning first to the evidence on Bermuda’s income inequality, Figure 1 recreates a chart first used by Nathan Kowalski in his Financial Ramblings from the Rock column. The chart displays the wage rates of the top and bottom paying occupational job categories published by the Department of Statistics in their annual The Bermuda Job Market: Employment Briefs. The top-paying occupational category is termed “Senior Officials and Managers” while the bottom is “Service Workers and Shop and Market Sales Workers.”
The pay in each category has been rebased to 100 at the start of the period for comparability and over the eight years to 2016 the income of top-paying jobs had risen to 121 while that of bottom-paying jobs had increased to only 114. These figures are in nominal terms, so the effects of inflation are not accounted for. Over the same period, Bermuda’s consumer prices rose 20.1% resulting in the income of bottom-paying jobs in real terms falling by more than 5% while the top-paying jobs barely stayed ahead of inflation.
Figure 1
But is this widening pay inequality present in Bermuda’s longer term data? Unfortunately, using these occupational job categories we are unable to make direct comparisons over longer time scales due to changes made in 2008 by the Department of Statistics in their classification methodology. The merging of some jobs and a further parsing of others in this change resulted in our occupational job categories of today not precisely corresponding to those prior to 2008.
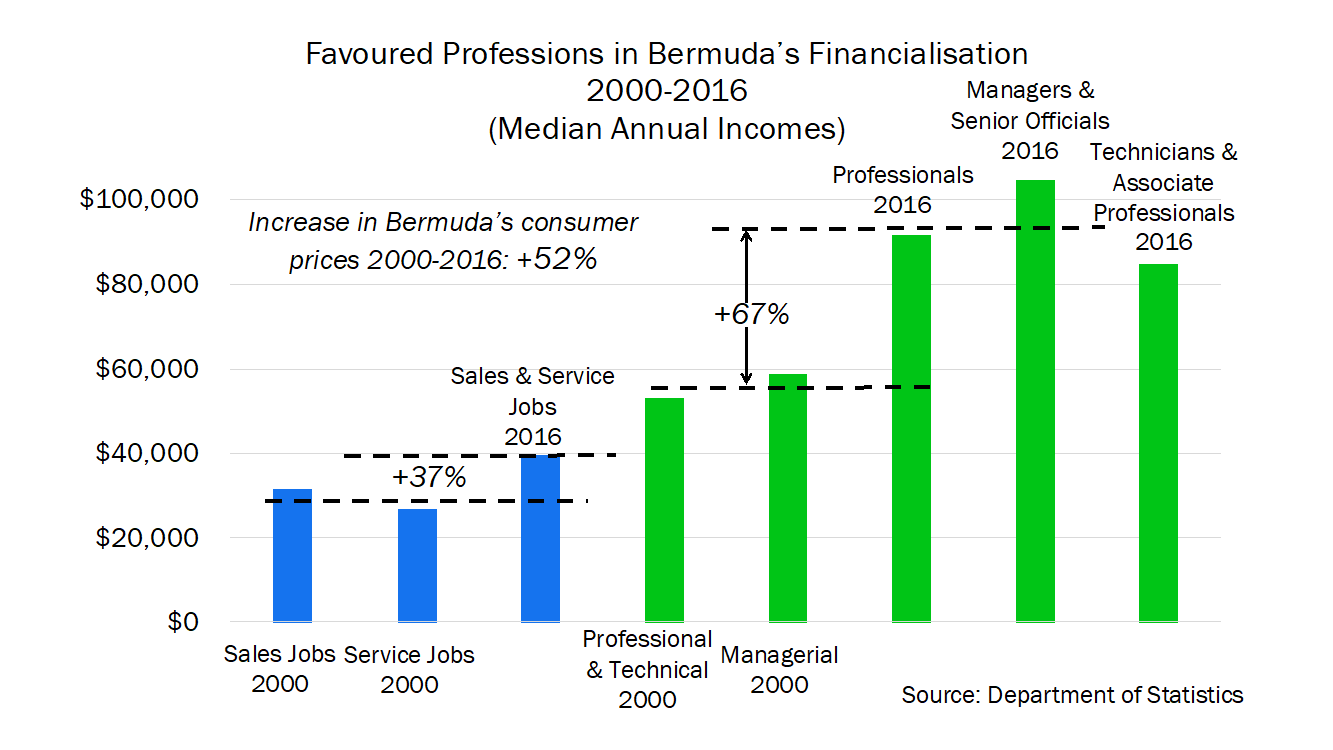
For our purposes, however, this is not an insurmountable obstacle as Bermuda’s lower-paying and higher-paying jobs have remained isolated in distinctly different categories. In fact, in examining groupings of occupational categories across longer periods of time we can capture much of the desired information. Figure 2 presents data from two separate groupings of occupational categories for the period 2000-2016. Here sales and service jobs started in two different categories and ended in one, while the managerial and professional jobs started in two categories and ended in three. By taking averages of comparable categories, we can approximate the change in income for each of these two different groupings over the 2000-2016 period.
The longer term data shows a continuation of much the same trends. Nominal pay increases for sales and service jobs rose by 37% over the sixteen-year period while managerial and professional jobs saw a 67% increase in pay. Meanwhile, over the same period, Bermuda’s consumer prices increased by 52% resulting in the real performance of these pay increases being virtual mirror images of each other. Once the effects of inflation are removed, sales and service pay fell by almost 10% while managerial and professional pay increased by almost 10%.
Figure 2
Providing further information on our relative pay performance, Figure 3 displays the “wage increases” from as far back as 1993 for two occupational job categories that have not been redefined by the Department of Statistics in the intervening period. Again, both “Clerical” and “Agricultural & Fisheries” jobs have been rebased to 100 at the start of the period. Here wage increases are reported in real terms, so the effects of inflation have been removed. Additionally, Bermuda’s productivity performance is included as an indication of growth in the island’s total real income.
Both job categories are relatively low-income in relation to average salaries in Bermuda, but their distinctly diverging wage performance reflects our labour market’s severe dislocation caused by the inordinate rise of finance on the island and our failure to diversify the economy. While not receiving the same wage increases as high-income workers in Bermuda, as office workers clerical staff have fared considerably better than other low-paid workers on the island.
Figure 3
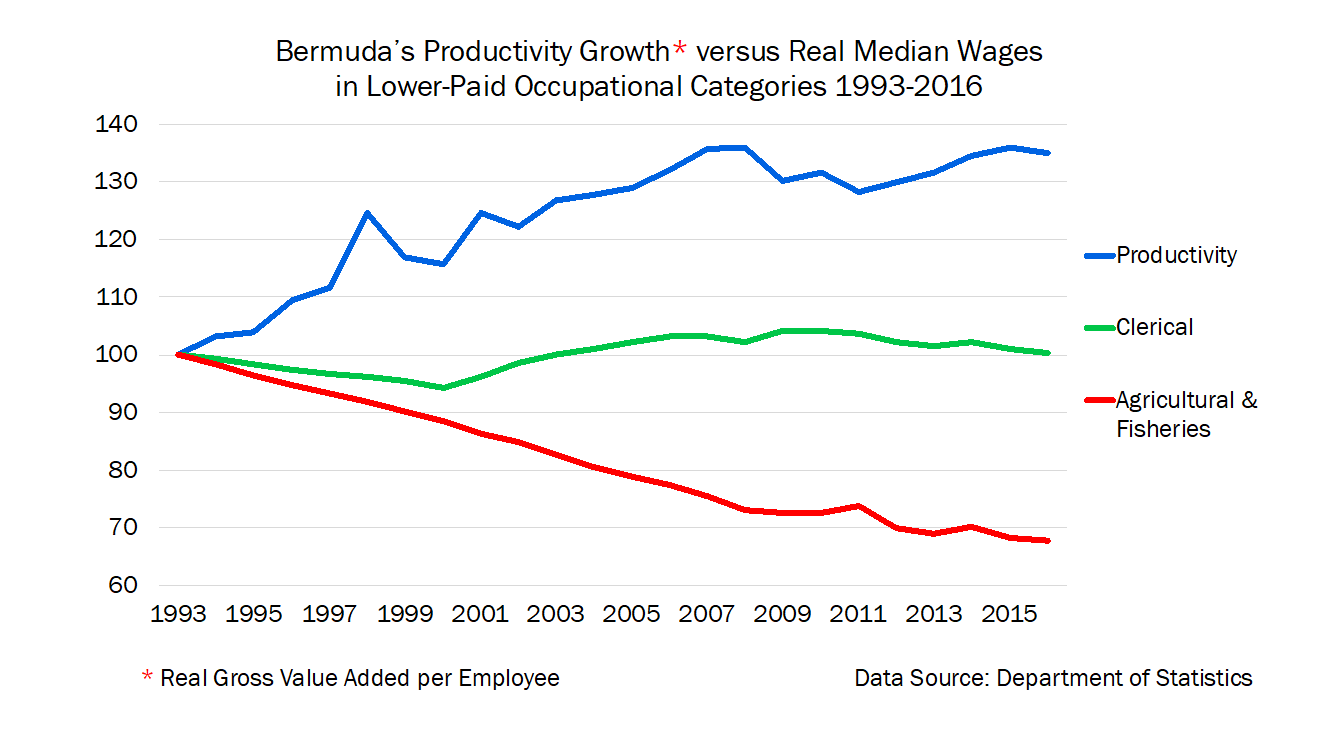
The diverging performance of these income categories could not be more stark. As Bermuda’s productivity increased 35% in the 23 years to 2016, the real pay of Clerical workers was unchanged while Agricultural & Fisheries employees saw a 32% decline in their pay-checks when adjusted for inflation. And, as a point of order, Bermuda’s Agricultural & Fisheries workers are not overwhelmingly cheap foreign labour – at least not foreign. According to our Department of Statistics, in 2016 Bermudians comprised 48% of our Agriculture & Fisheries workers.
Importantly, these trends of rising income inequality also are reflected in our widest measures of personal income in Bermuda and over the same time period. The data presented in Figure 4 is taken from Bermuda’s Household Expenditure Survey of 1993 and the just released 2016 Bermuda Census and it reflects the entire income of Bermuda’s household sector.
Here household income includes not just all occupational job categories but the household income of retirees as well. Additionally, income for each household is not restricted to the annual income derived from main jobs or pensions but, in fact, all income including capital income (such as rents, dividends and the proprietary income of partnerships and the self-employed) and government transfers (such as Bermuda’s financial assistance programme.) As such, it is Bermuda’s widest measure of personal income and the consistency in its methodology of calculation from 1993 to 2016 make the data directly comparable.
The data in Figure 4 reflect the differences between average and median household incomes in Bermuda. Both the median and average are measures of central tendency but the median gives us the value of “the man in the middle” whereas average measures are influenced by changes in values across an entire distribution.
To illustrate the difference with a simple example, if three individuals were paid $10,000, $20,000 and $30,000 annually, both their median and average value would be $20,000. Now if the top paid individual’s income were to increase to $60,000 while the other incomes remained the same, the median measure would still be $20,000, while the average would rise to $30,000.
Figure 4
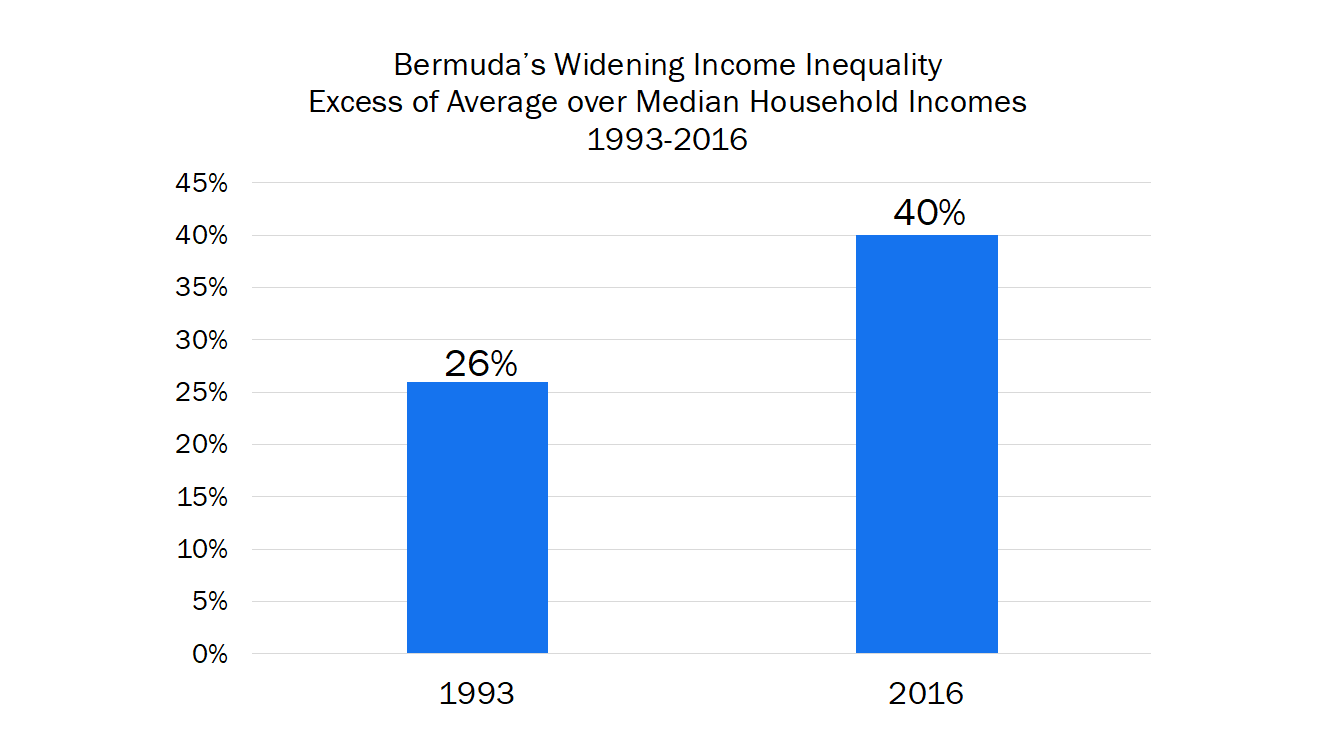
In 1993, Bermuda’s average household income stood at BD$65,676 while the median income, the “household in the middle,” was BD$52,295, or in other words our average income exceeded the median by 26%. In 2016, our average household income was BD$131,074 while our median income was BD$93,713, bringing the excess of average over median incomes to 40%.
Clearly, in the twenty-three years to 2016 Bermuda’s household income gains in the top half of our income distribution exceeded those in the bottom half by a considerable margin. As indicated by this data, since 1993 Bermuda’s rising income inequality has not only been sustained over an extended period but has been widespread when including all forms of household income.
And how severe is our income inequality? How do we compare internationally? For technical reasons, Bermuda’s average-to-median ratio is our best measure of income inequality in making international comparisons. Unlike other countries, our Department of Statistics does not publish household income on an “equivalised” basis, so our data is not directly comparable to that of most countries.
Equivalised incomes adjust household incomes for the size and composition of each household so individual household incomes are directly comparable in terms of their ability to maintain the same standard of living for each household occupant. Measures of central tendency are least affected by switching between equivalised and unequivalised income data, making our average-to-median income ratios the most appropriate for international comparative analyses.
As seen in Figure 5, by this measure Bermuda’s income inequality has escalated to amongst the highest in the world. Figure 5 contains data from the 35 countries comprising the OECD and amongst these countries Bermuda’s income inequality is surpassed only by Chile and Mexico. Of every region of the world, Central and South America has the very highest levels of income inequality, so by this measure Bermuda is fast approaching the rarefied company of the most unequal countries in the world.
Figure 5
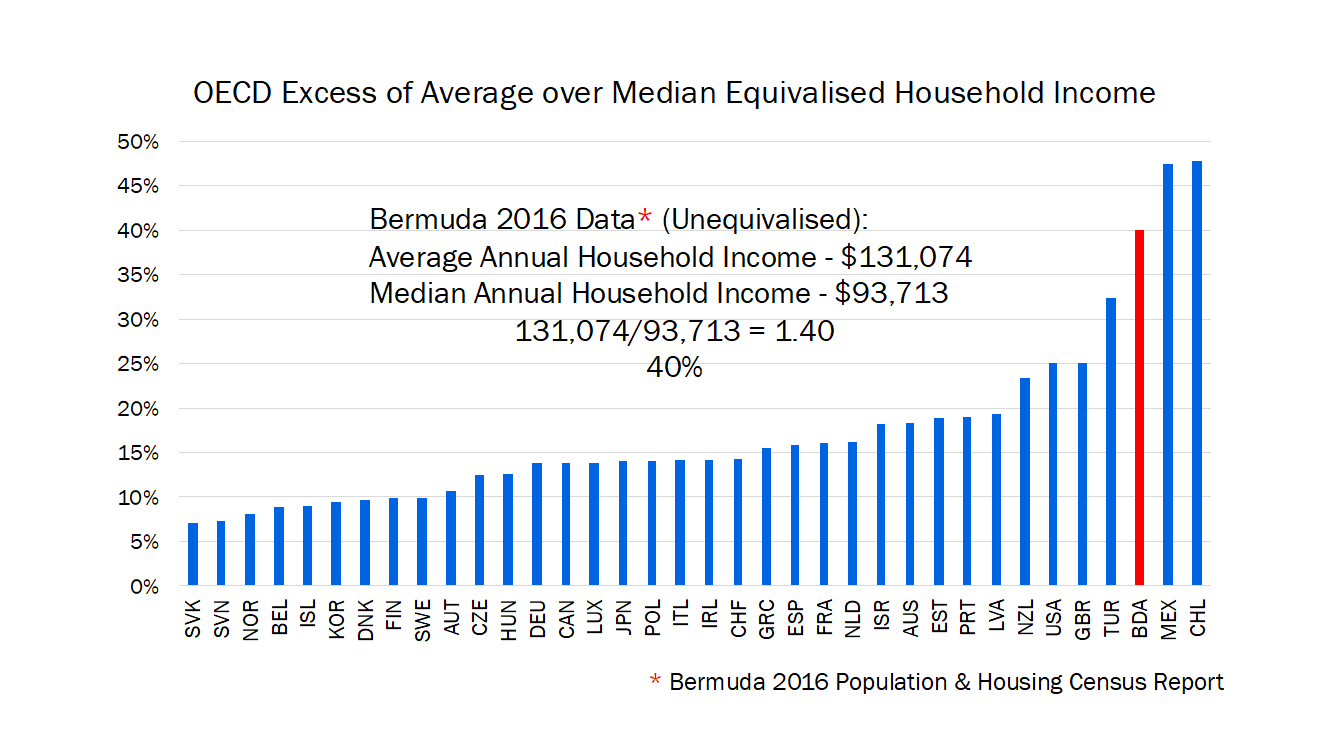
In fact, this data indicates that of the two countries most familiar to Bermudians with notoriously high levels of income inequality, the United States and United Kingdom, both have lower levels of income inequality today than Bermuda had in 1993, prior to the onset of our latest prolonged period of widening inequality. Without question, Bermuda’s level of income inequality has reached levels in 2018 which can be classified internationally only as extreme.
Figure 6
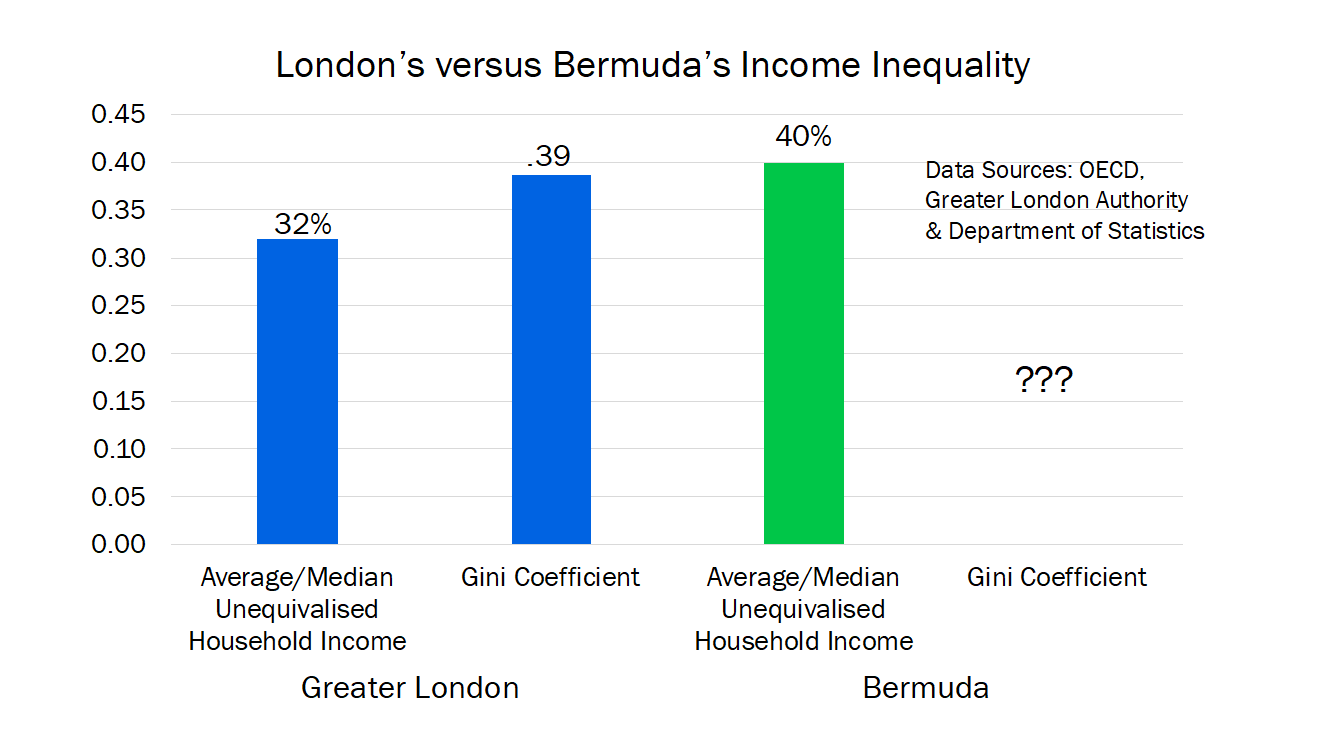
Finally, in spite of the island’s severe data limitations, yet another informative international inequality comparison is provided in Figure 6. Here Bermuda’s average-to-median income ratio is shown relative to London’s, which of all Britain’s cities or regions has the most severe income inequality. The Greater London Authority publishes household income data on an unequivalised basis, so the data displayed here is even more comparable than the earlier comparisons made with the OECD.
Compounding Bermuda’s problem of income inequality is our antiquated tax system. More specifically, the gross regressivity of the island’s tax structure not only magnifies the intensity of our inequality, producing greater inequality in after-tax incomes than pre-tax incomes, but our heavy reliance on inherently regressive consumption taxes promotes even greater disparities in the standards of living amongst households of varying income.
Figure 7 illustrates the extreme regressivity in Bermuda’s tax structure. Here each of the island’s main tax revenues – payroll taxes, customs duties and land tax – are represented in terms of their tax incidence across Bermuda’s income distribution.
Tax incidence makes the important distinction between who ultimately bears the burden of taxes paid versus who is legally responsible for payment of a tax. If payroll taxes are increased but companies ultimately recoup the cost of higher taxes paid by giving employees lower increases in their future take-home pay, then the incidence of payroll taxation falls on the employee rather than the employer. Similarly, if a hike in customs duties is fully passed on to the end consumer even though the importer is legally responsible for its payment, the incidence of custom duties falls on the consumer.
Figure 7
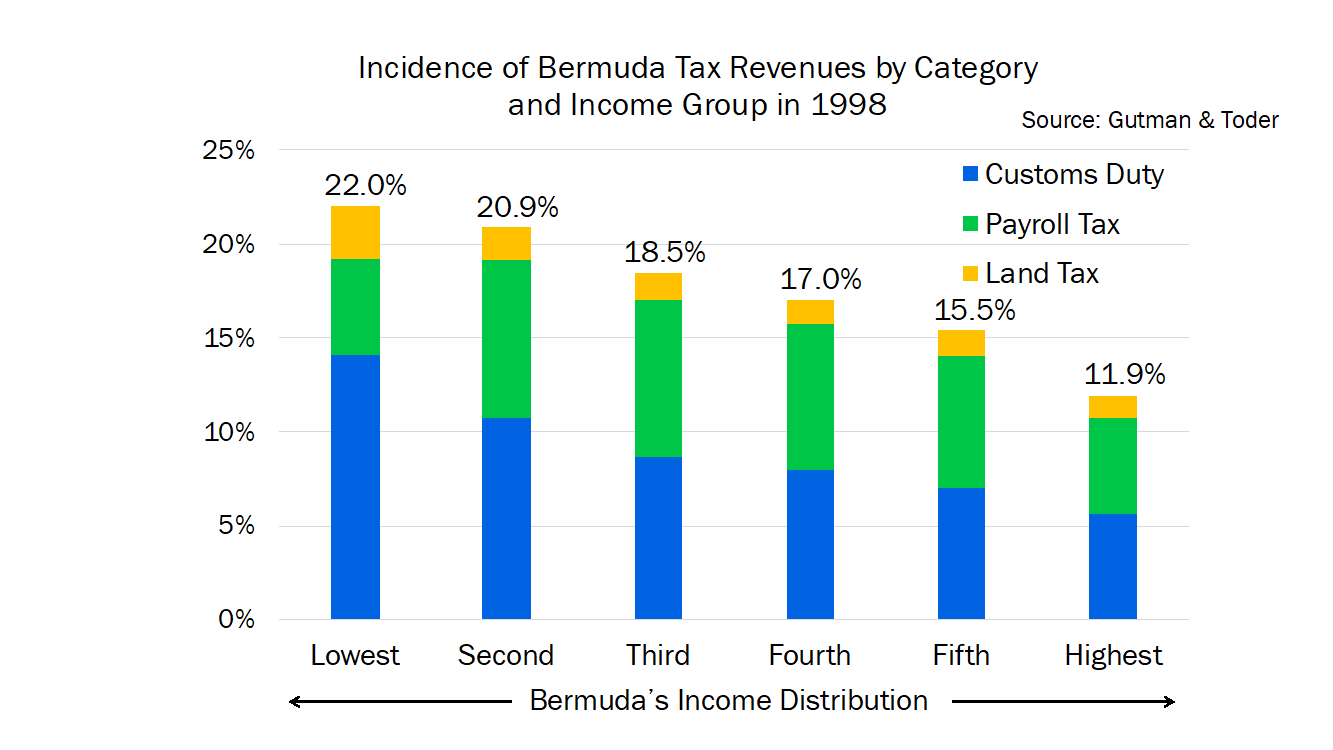
As shown in Figure 7, the incidence of taxation in each of the Bermuda Government’s major revenue streams is regressive. The regressivity of Bermuda’s payroll tax is due largely to the fact Bermudians have resisted the adoption of a personal income tax which would capture the taxation of capital as well as labour income. As a consequence, the island only taxes about 2/3 of households’ income and high income households, as the holders of the overwhelming majority of the island’s capital, are receiving significant preferential treatment under the present system.
Such preferential treatment results in even greater inequality of income post-payroll taxes than inequality before taxes and Bermuda’s heavy reliance on customs duties not only raises the island’s cost of living, harming the economy’s international competitiveness, but further amplifies the regressivity of our tax structure as the incidence of customs duties as a share of household income falls inordinately on the poor.
Not surprisingly, the island’s extreme income inequality, severe tax regressivity and exorbitant cost of living provide the perfect cocktail for widespread economic deprivation and poverty. Like many jurisdictions around the world, Bermuda has long resisted recognising its true prevalence of poverty.
Measures of poverty, however, that do exist in similar jurisdictions as Bermuda are highly indicative of the likely scale of our problem. Figure 8 shows the poverty rates of many of the island’s competitors from the offshore and onshore worlds. The similarities between Bermuda and these countries varies from jurisdiction to jurisdiction.
Each of these jurisdictions hosts sizeable finance industries but the degree to which finance dominates each country’s economy varies considerably. Finance comprises only 6% and 9% of the UK and Swiss economies respectively, while forming 13% of GDP in Singapore and 18% in Hong Kong, but amongst Guernsey, Jersey and Bermuda finance comprises between 39% to 41% of our economies. Government revenues in relation to the economy vary considerably as well. At 16%, Bermuda has the smallest government revenues to GDP ratio, while Hong Kong and Singapore are both below 20%, Jersey and Guernsey fall between 20% to 25%, with government revenues greater than 25% of GDP in each of the rest.
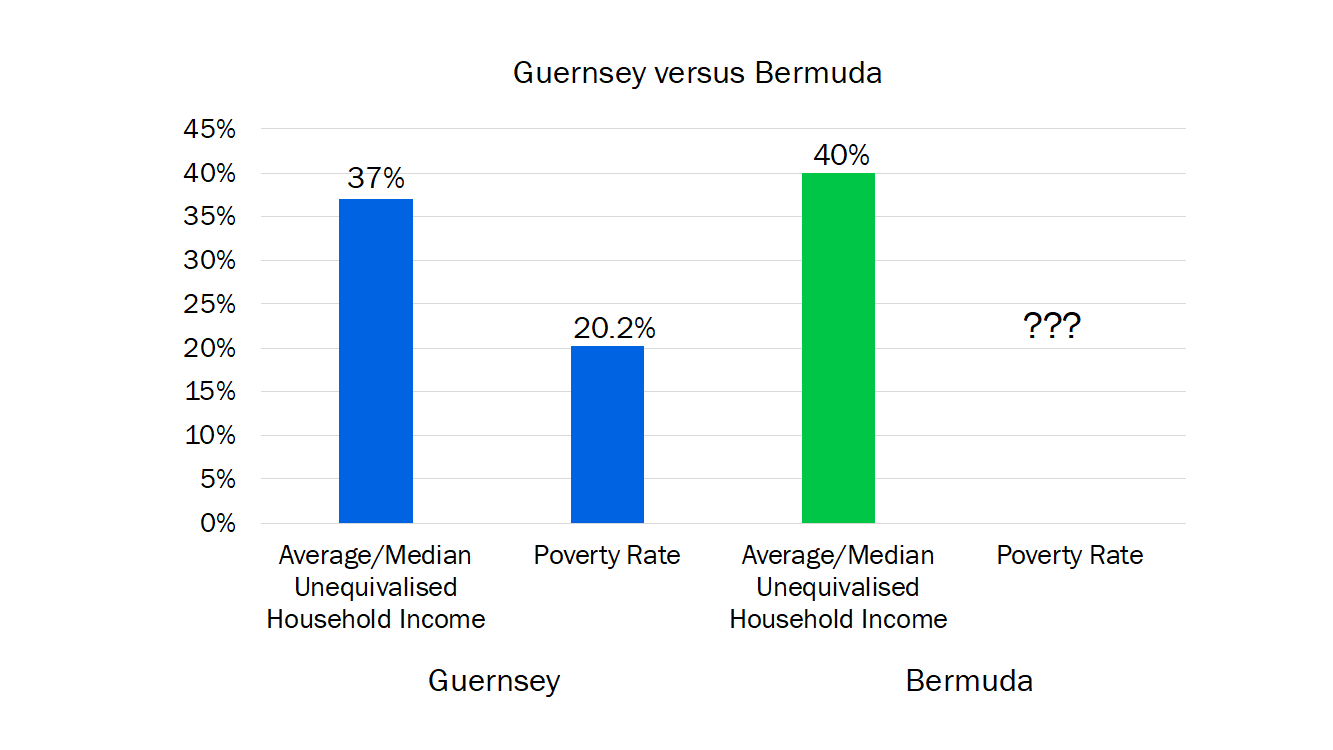
Clearly jurisdictions with elevated levels of finance and low levels of government revenues are at risk of high poverty. Jersey tracks its poverty every five years on a before and after housing costs basis and, once housing costs are removed from the calculation, poverty as of 2015 was estimated to be as high as 18%. Similarly, Guernsey provide their public with detailed analyses of the island’s poverty and their most recent report released just last November revealed it had risen to 20.2%.
Figure 8
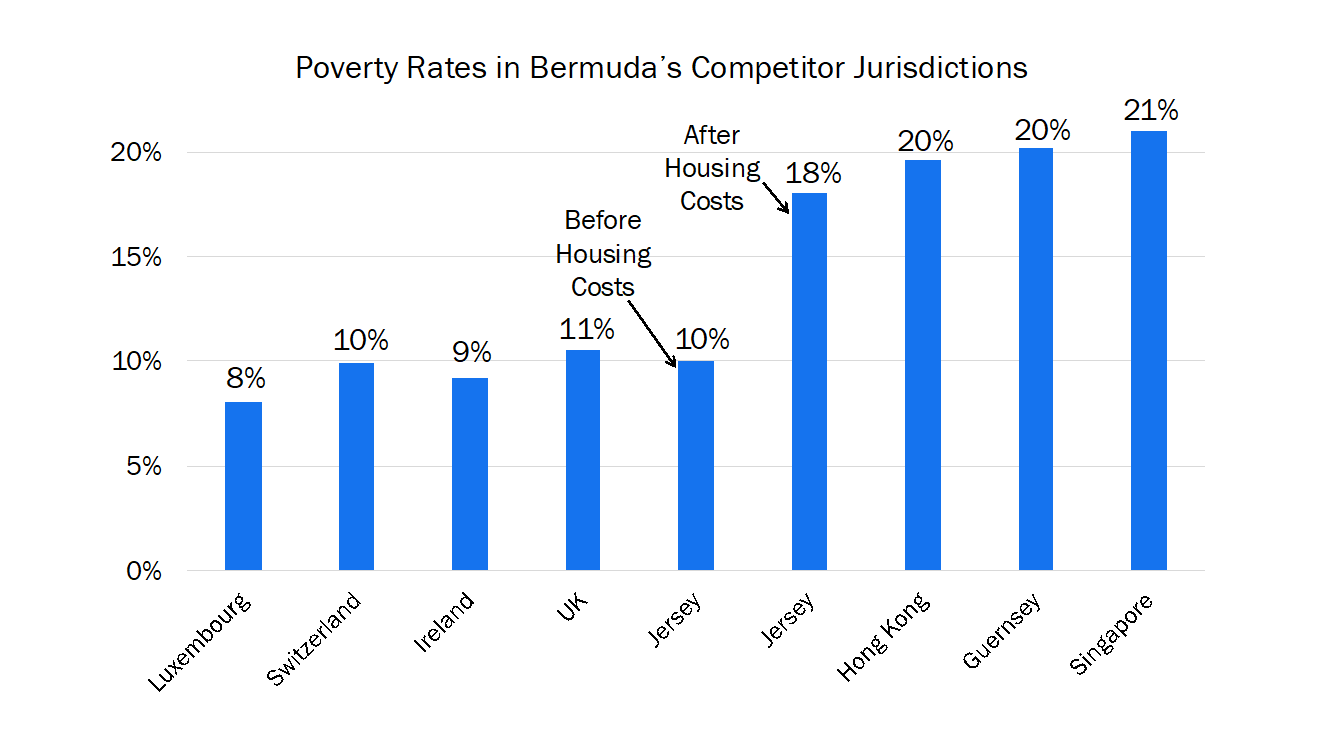
Since 2012, Hong Kong has published its incidence of poverty on an annual basis with the latest data showing poverty edging higher to 19.6% in 2016 despite Hong Kong’s relatively strong economic growth. Singapore on the other hand continues to resist calls to recognise widespread poverty despite ongoing pressure from academics and civil advocacy groups. But an analysis of poverty by academics in Singapore using data dated as long ago as 2008 produced an estimate of 21%.
Extending our international mosaic of inequality and poverty statistics is additional data from Guernsey – the Crown Dependency with not only an industry makeup very similar to that of our own economy, but of virtually identical land mass and population as ourselves as well. Obligingly, Guernsey’s statisticians publish their household income data on an equivalised and unequivalised basis allowing us to make the same comparison as we did earlier with London. As seen in Figure 9, while possibly not as severe as Bermuda’s, Guernsey is contending with inequality and poverty levels which, at least amongst developed, high-income countries, represents the world’s most extreme.
Figure 9
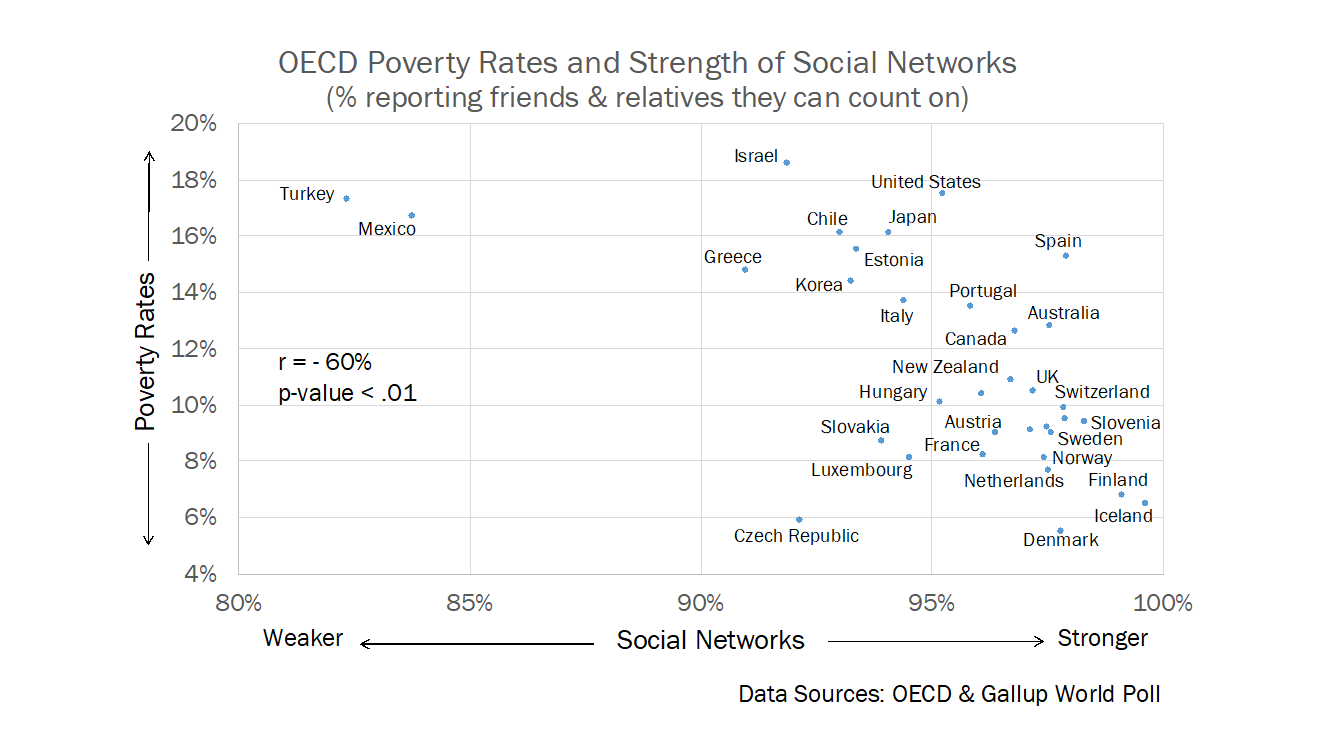
Providing further evidence of Bermuda’s problem with pervasive poverty is our well documented presence of a litany of the social ills typically found accompanying widespread poverty. Figures 10 – 14 illustrate just five of these, demonstrating the close relationship between poverty and the incidence of obesity, infant mortality, murder, incarceration and the strength of social networks throughout the OECD.
Figure 10
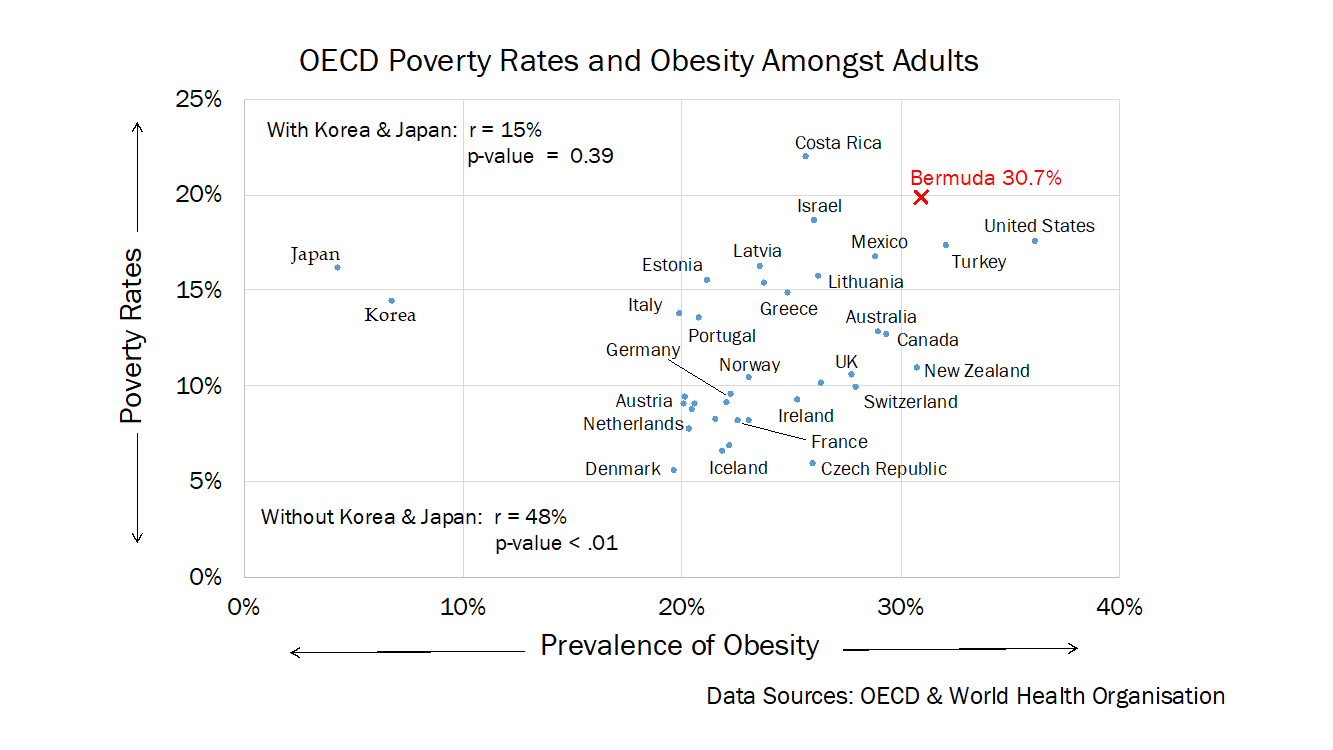
Figure 11
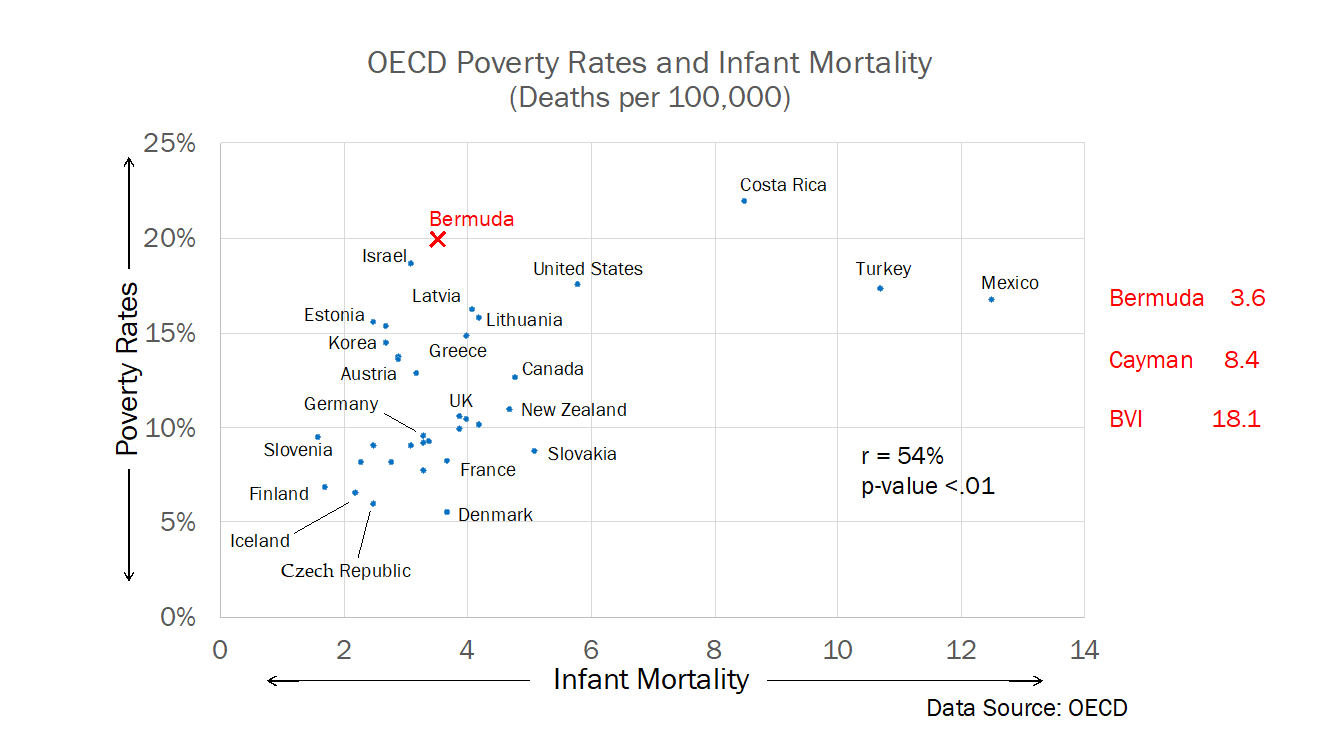
Figure 12
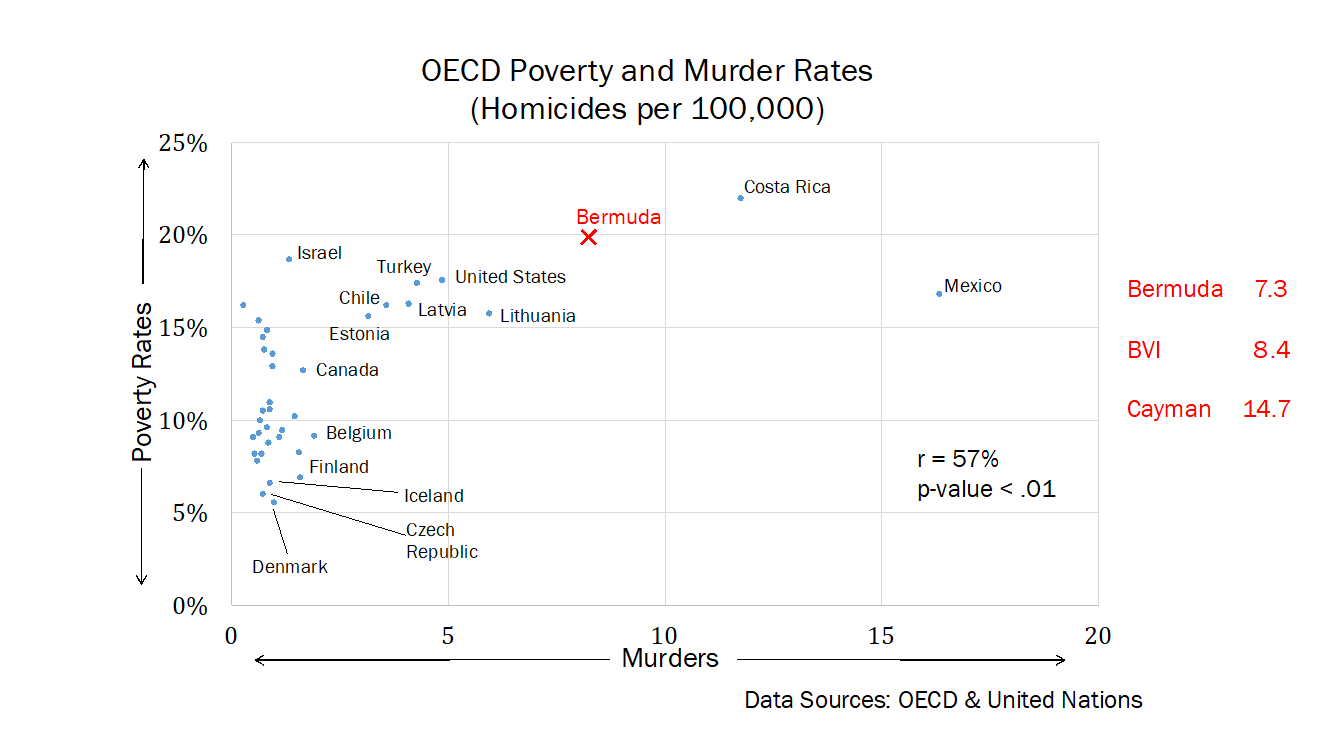
Figure 13
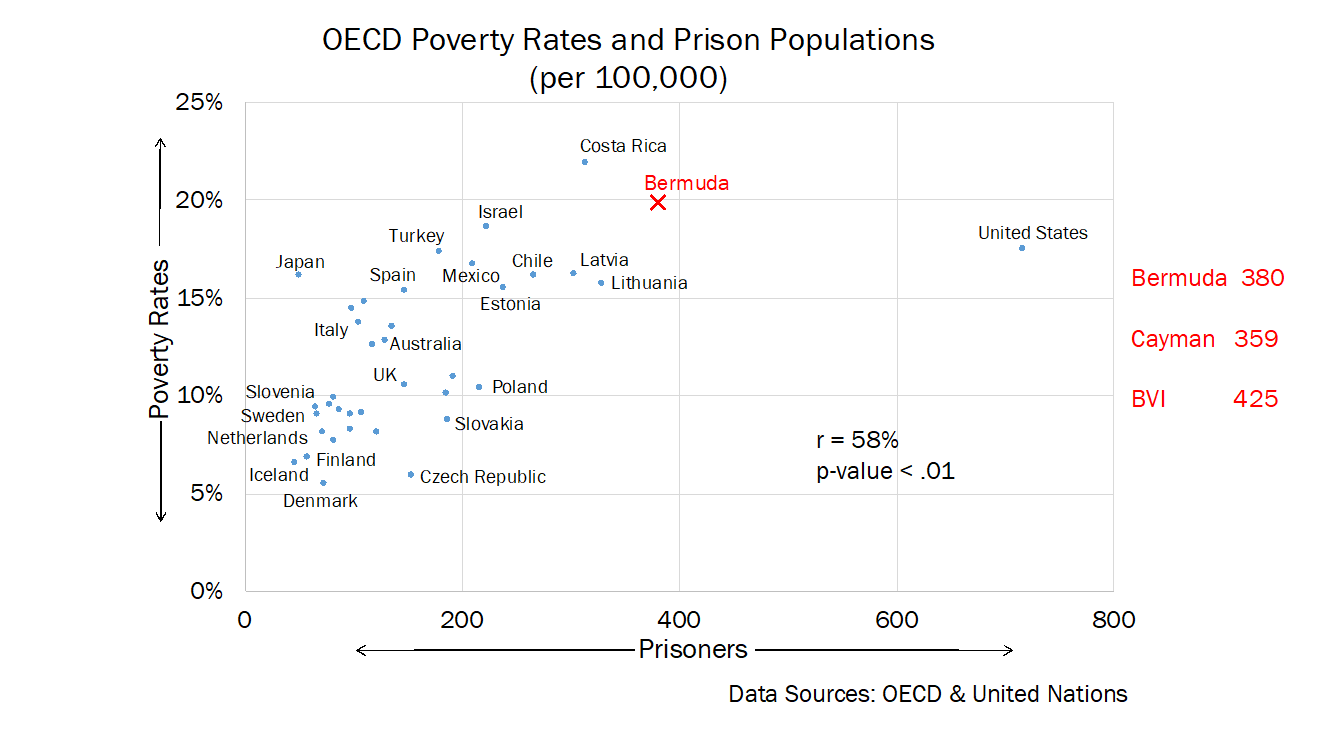
Figure 14
Poverty and income inequality more generally have been linked to a host of other social problems ranging from teenage pregnancy, poor educational outcomes, poor life satisfaction and lower social mobility. Needless to say, despite Bermuda’s reluctance to acknowledge its true prevalence of poverty, every indication points to the existence of an acute problem.
By now, extensive global research establishes a number of economic, social and cultural factors as contributing to the development of extreme inequality and rising poverty, many of which we have evidence of in Bermuda today. Perhaps most significant amongst these is the encoding of preferential treatment of capital over labour and high income households over low income households in contemporary tax structures. As amply demonstrated in Figure 7, Bermuda unfortunately has been a world leader in this area.
Another leading cause of these conditions has been a systemic undermining of the bargaining power of labour due to a multitude of changes in government policy, accepted corporate practices and changes in general economic thinking in the public and private sectors. Indeed, it is not an unfair characterisation to say “labour” has been regularly demonised since the 1970’s in business, government and financial circles as posing an obstacle to the necessary reforms needed to enhance productivity and competitiveness.
In diagnosing the principle economic problems of our times, rarely does the focus of attention shift from labour to capital in examining its potential as the genesis of economic inefficiencies, inequities and hardships. As is historically typical during the ascendancy and dominance of economically “laissez-faire” ideological times, the balance of power has shifted decisively from labour to capital.
Bermuda certainly has not been immune to these global trends. Here too unions have been demonised and their critical role played in bargaining for fair pay and decent working conditions denigrated. As in the rest of the world, the ascendency of capital’s power in Bermuda has occurred simultaneously with a dwindling of union membership.
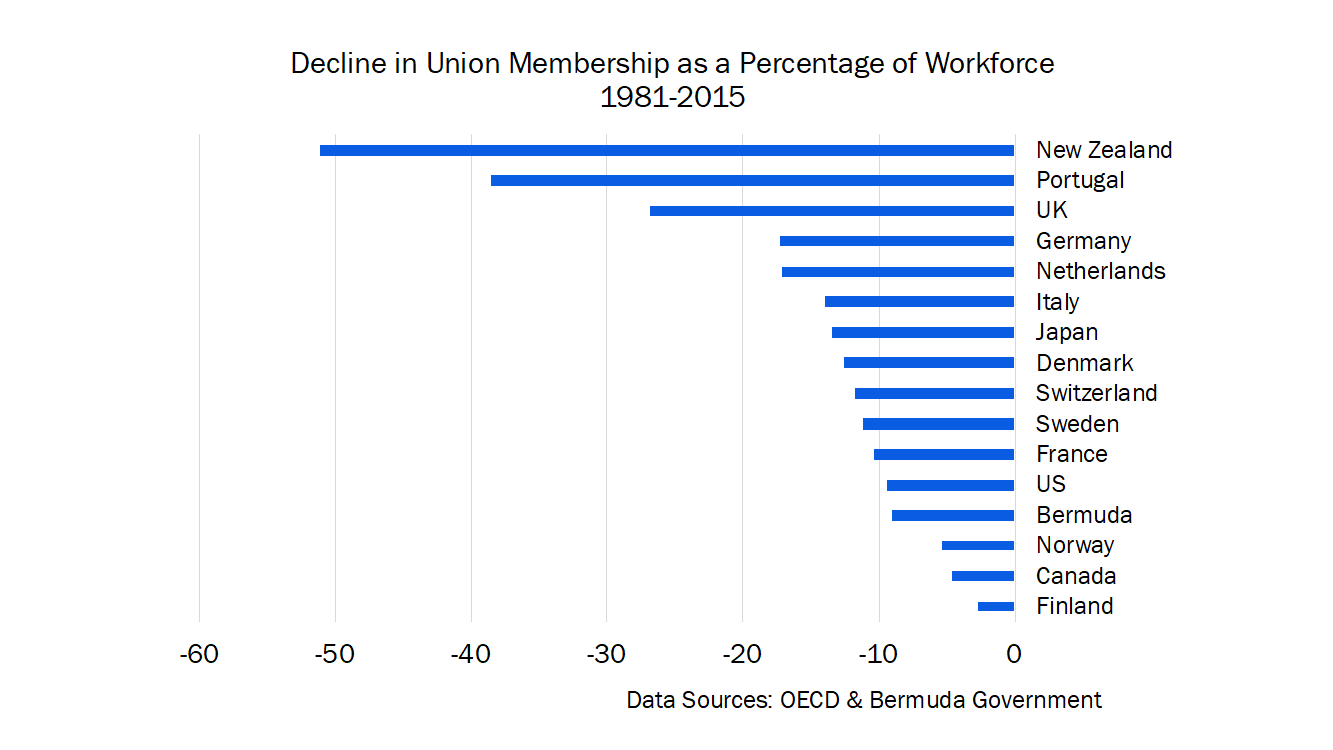
Figure 15 shows the Bermuda Industrial Union’s membership has declined by as much as 40% since 1981. As a relatively “laissez-faire” country to begin with, Bermuda’s union membership was always comparatively low. These trends have had an even greater impact on union participation rates overseas. As seen in Figure 16, since 1981 union membership has fallen far more precipitously in many other countries worldwide.
Figure 15
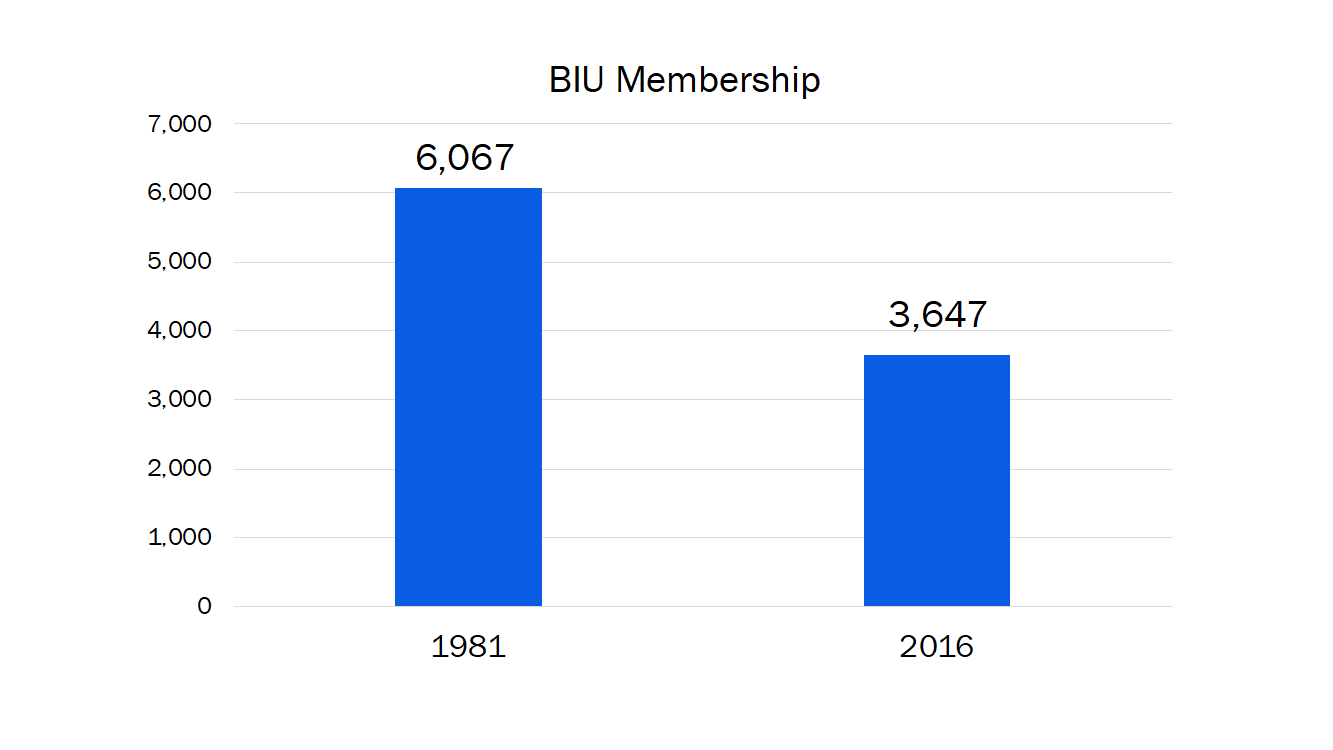
Figure 16
Thus far, the identified remedies to inequality and the growing prevalence of poverty globally include a number of measures, but foremost amongst them is the now widely recognised, critical role played by public policy interventions to raise the rate of market pay amongst low-income workers. That is to say, contemporary levels of inequality and poverty are identified now as due to, in the main, malfunctioning labour markets and, amongst the range of effective public policy measures to address these market imperfections, most important is the implementation of statutory living wages.
Robert Stubbs is an economist, CFA, holds an International Bond Dealer Diploma (ICMA) and has completed the ACAS actuarial exams. He was formerly Head of Research for Bank of Bermuda and his professional interests at present lie in enterprise risk management.
The author

Related articles

Public finance is feminist terrain

New Tax Justice Network reports on real estate transparency
Beneficial Ownership of Real Estate Around the World
7 July 2026
Integrating the Collection, Use and Exchange of Real Estate Ownership Information
7 July 2026

Introducing the Real Estate Secrecy Index

Indicator deep dive: Golden Visas

She cleans your house but the tax system can’t see her

Finally, the European Court of Justice cracks down on trusts
Joint submission: International financial architecture, debt and the right to education
20 May 2026
