
Illicit financial flows are transfers of money from one country to another that are forbidden by law, rules or custom. They damage economies, societies, public finances and governance of countries around the globe. A key challenge to tackling illicit financial flows is the difficulty countries face in identifying which financial flows carry the largest risk to their economies. The Tax Justice Network is today launching the Illicit Financial Flows Vulnerability Tracker to help countries identify the trading partners and channels that pose the greatest risks to their economies.
Our previous research identified the eight main channels in which illicit financial flows take place: trade (exports and imports), banking positions (claims and liabilities), foreign direct investment (outward and inward) and portfolio investment (outward and inward).
For each of the eight different channels through which illicit financial flows operate, we calculated three measures.
Vulnerability captures how financially secretive the country’s trade, investment or banking partners are. Vulnerability reports the average financial secrecy level of all partners with which the country trades or invests for a given channel, weighted by the volume of trade or investment each partner is responsible. For example, if all the inward foreign direct investment a country receives comes from the Cayman Islands, one of the world’s greatest enablers of financial secrecy, the country would have a high vulnerability measure on foreign direct investments.
- Intensity reports the share of national GDP that the channel makes up, helping capture the importance of the channel to the country. Intensity does not measure the secrecy involved in the channel nor the risks of illicit finanical flows the channel poses. For example, foreign direct investments may represent 10 per cent of a country’s GDP.
- Exposure combines a channel’s vulnerability and intensity to estimate the share of a country’s GDP exposed to illicit financial flows by the channel. Comparing the exposure levels of different channels helps countries identify the channels that most expose their economies to illicit financial flows. For example, if a country’s inward foreign direct investment channel has a vulnerability of 76 and the channel accounts for 10 per cent of the country’s GDP, the country’s exposure score in inward foreign direct investment would be 7.6 per cent. This means 7.6 per cent of the country’s GDP is exposed to illegal transfers of money.
The Tax Justice Network’s new Illicit Financial Flows Vulnerability Tracker allows users to explore illicit financial flows data with interactive tools, and understand which countries are more vulnerable to illicit financial flows, and more importantly, why: which partner countries and which channels are responsible for the vulnerability in a country’s economy.
The tracker consists of three tools: map view, country profiles and country comparison.
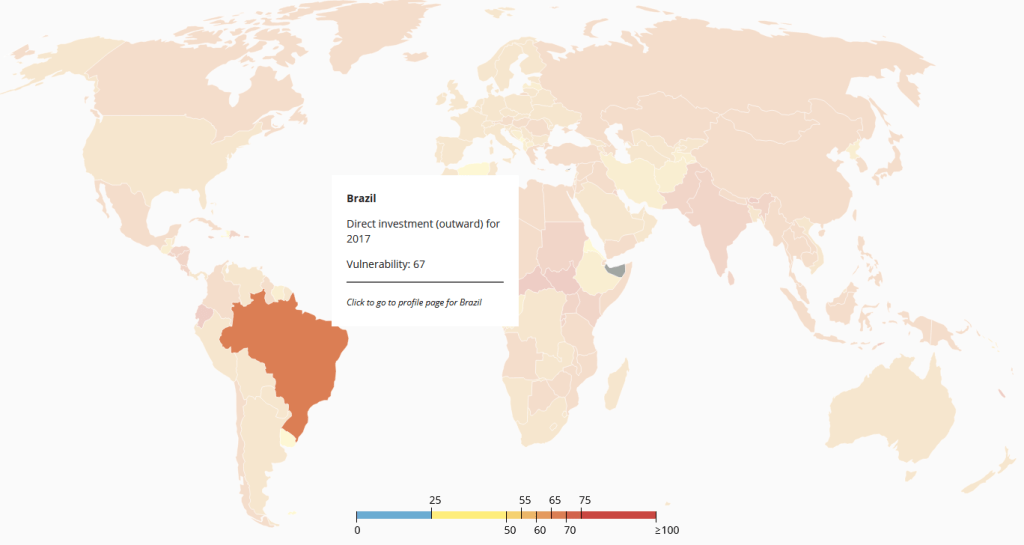
Tool 1: Map view
The interactive map allows users to understand which countries and regions are more vulnerable to illicit financial flows. For example, we see that the vulnerability of Brazil to outward foreign direct investment in 2017 is 67 (a very high score). This implies that Brazilian residents own many companies in places with high levels of financial secrecy, indicating high risks for illicit financial flows (and offshore tax evasion) to occur via direct investment.
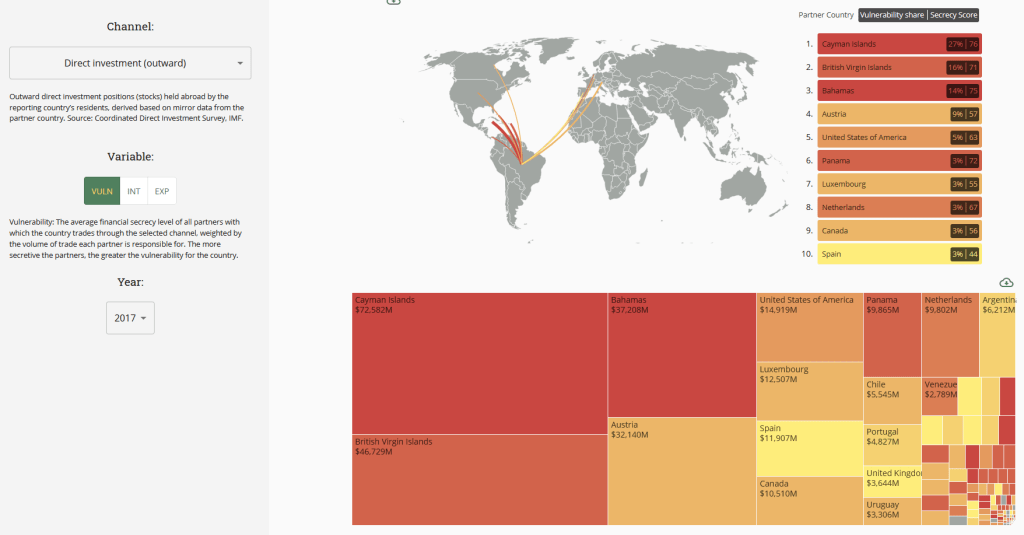
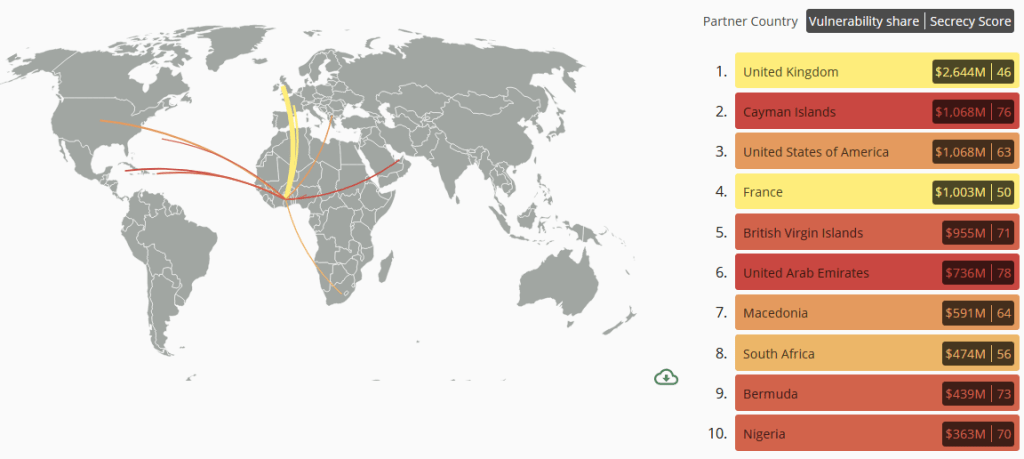
Tool 2: Country profile
Clicking on a country (or clicking on “country profiles” in the top menu) takes you to the country profile page of the country you selected. Each country’s profile page provides a detailed breakdown of the 10 trading partners that are most responsible for the country’s vulnerability, intensity or exposure for a given channel. Country profile pages also allow you to see year to year changes in a country’s vulnerability, intensity or exposure levels for all eight channels. In the case of Brazil’s country profile, the webpage shows that high vulnerability to outward direct investment is caused by the top three partner countries: Cayman Islands (responsible of 27 per cent of the vulnerability), British Virgin Islands (17 per cent) and Bahamas (14 per cent)). Cayman Islands—with a secrecy score of 76, British Virgin Islands—with a secrecy score of 71and Bahamas—with a secrecy score of 75— are three of the most secretive countries in the world. The left panel allows the user to easily switch between channels, variables and years.
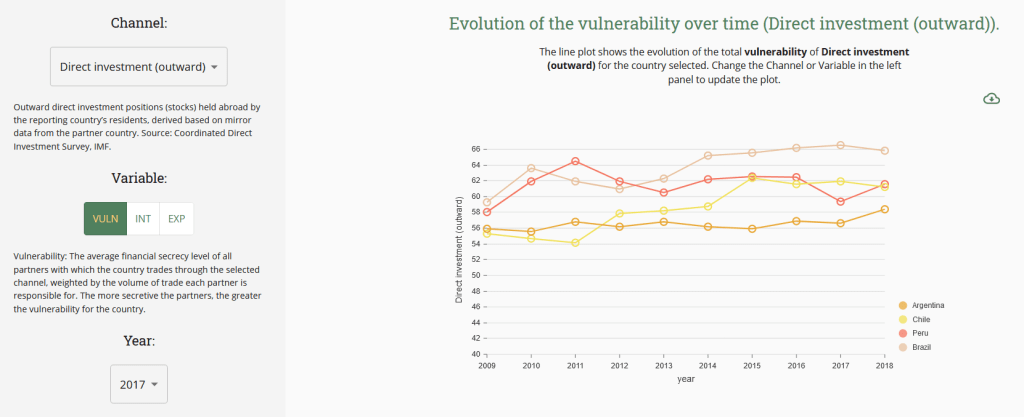
Tool 3: Comparison tool
Finally, the comparison tool allows you to compare countries’ vulnerabilities, intensities and exposures across different channels. For example, comparing Brazil, Chile, Argentina and Peru, we can observe that Brazil is highly vulnerable to illicit financial flows. While Peru’s vulnerability has decreased over time, Brazil’s remained constant.
The rest of this blog provides three case studies we’ve compiled on Ukraine, Ghana and India by using the Illicit Financial Flows Vulnerability Tracker.
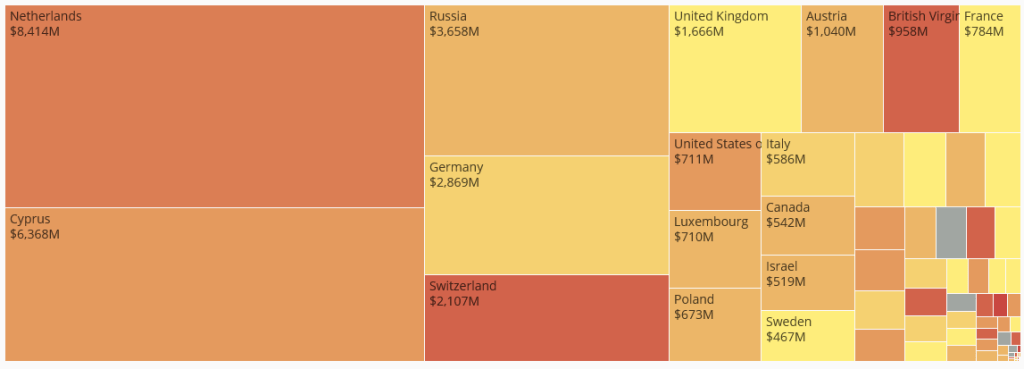
Case study 1: Ukraine
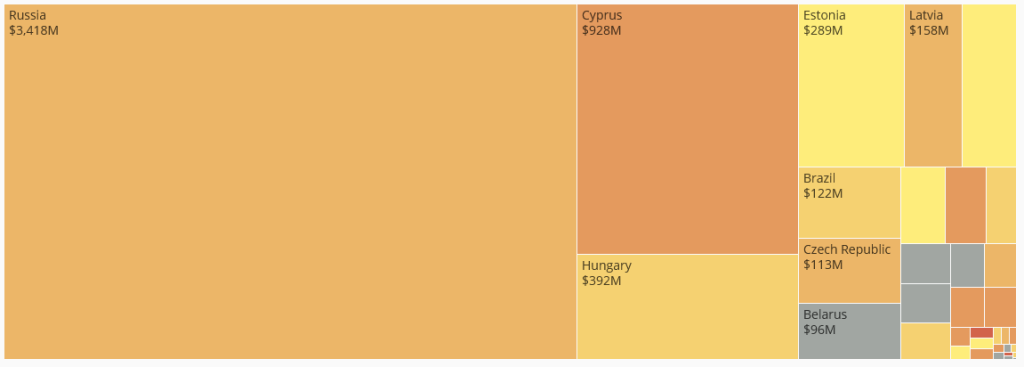
The majority of foreign direct investment entering Ukraine comes from three countries: the Netherlands, Cyprus and Russia. Other highly secretive jurisdiction, such as Switzerland and British Virgin Islands are also among the top investors in Ukraine.
Foreign direct investment (inward flow)
Foreign direct investment exiting Ukraine is primarily destined for Russia and Cyprus.
Foreign direct investment (outward flow)
Case study 2: Ghana
Ghana gained independence from the United Kingdom in 1957. However, the influence of the former empire is still highly present. Outward bank deposits are often situated in the United Kingdom and British Crown Dependencies Jersey and the Isle of Man.
Bank deposit (outward flow, claims)
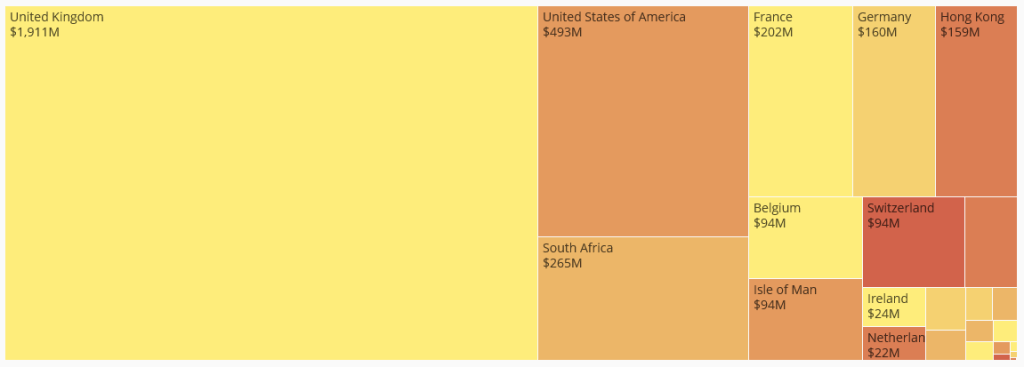
A large share of inward foreign direct investment comes the United Kingdom, and, concerningly, from highly secretive British Overseas Territories: the Cayman Islands, the British Virgin Islands and Bermuda.
Foreign direct investment (inward flow)
India: The Mauritius connection
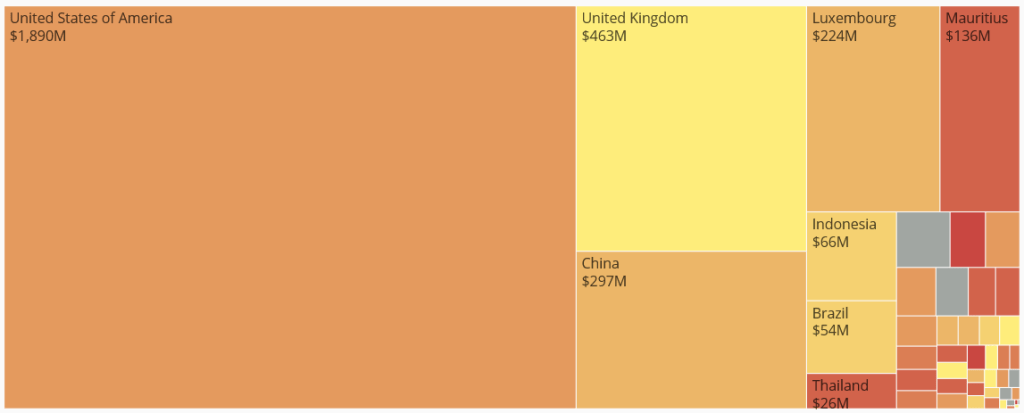
A large fraction of India’s inward foreign portfolio investment (non-controlling investment in equity and debt securities) enters the country via Mauritius, Luxembourg and Singapore, notorious corporate tax havens known for their roles as conduits. This is not so evident for outward foreign portfolio investment, dominated by flows to the United States and the United Kingdom.
Portfolio direct investment (inward flow, liabilities)
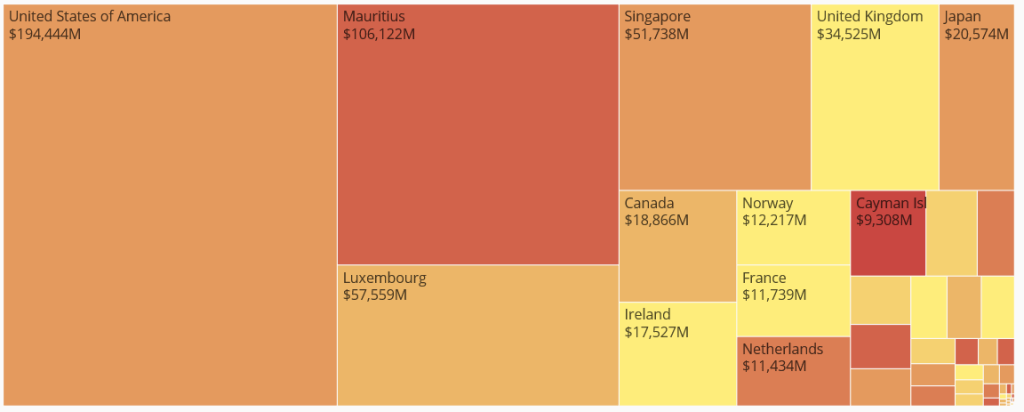
Portfolio direct investment (outward flow, assets)
The author

Related articles

UN tax convention hub – updates & resources

Public finance is feminist terrain

New Tax Justice Network reports on real estate transparency
Beneficial Ownership of Real Estate Around the World
7 July 2026
Integrating the Collection, Use and Exchange of Real Estate Ownership Information
7 July 2026

Four definitions to change the world: Struggles over meaning in the UN tax convention negotiations

Fiscal hell or mirage? What Spain’s wage debate gets wrong

Introducing the Real Estate Secrecy Index

Indicator deep dive: Golden Visas

The European Court of Human Rights has upheld the weaponisation of privacy to restrict tax authorities’ access to banking data
