
Updated with new data.
Over the years we’ve heard a lot of people saying that over half of world trade across borders takes place inside multinational corporations. The OECD in 2002 said:
more than 60% of world trade takes place within multinational enterprises
How reliable are these data? There has never been good sourcing on these figures – and it’s always been hard to pin down precise numbers on this as neither the WTO nor Comtrade break down their trade data to tell us how much takes part inside multinationals (“between related parties,” as they put it) and how much takes place between unrelated parties.
Different estimates have emerged over time
Back in 1995, by contrast, UNCTAD produced this graph (from p193 here), extrapolated from US trade data, suggesting that a third of world trade happened inside multinationals.
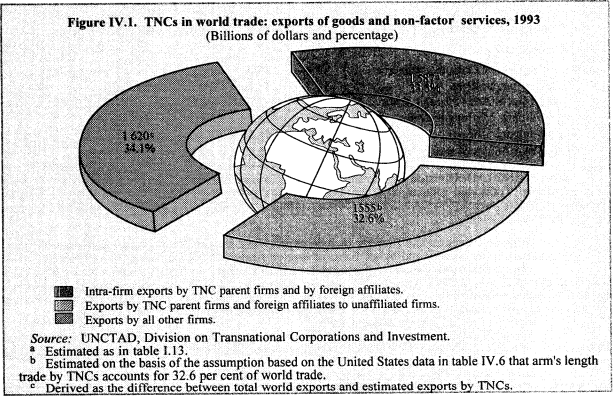
However, this appears to extrapolate from US data to give a figure for the whole world. Is this reasonable? We don’t know.
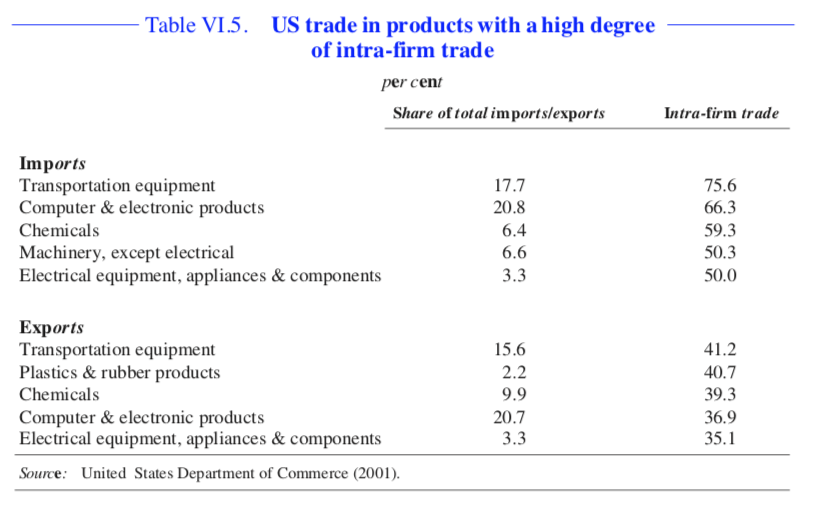
A subsequent chart, from the OECD, again based on US trade, shows wide variation across economic sectors:
And the same document also shows the trend of a steadily but not dramatically rising share (Table VI.I) over time: a World Bank research paper from 2017 (hat tip) estimated that intra-firm trade for US corporations grew at roughly six percent a year from 2010-2014 (Fig. 1, p2,) faster than trade between unrelated parties.)
Now some more recent country by country reporting (CbCR) data from the US Internal Revenue Service (IRS), containing 2016 data (Table 1A), also suggests a share close to one third:
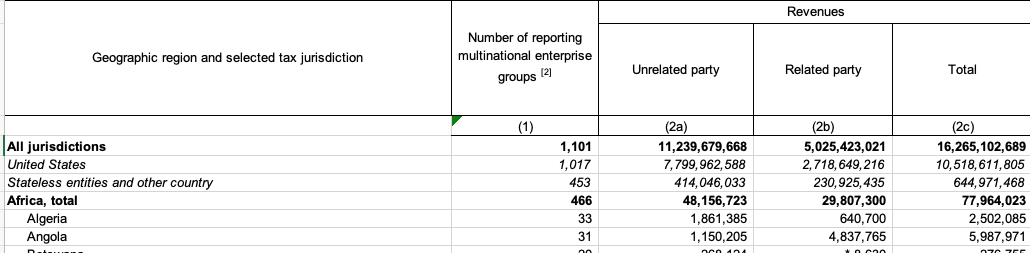
(The key ratio is 5.0 trillion divided by 16.3 trillion, which is 30.9 percent.)
This table, however, seems to include domestic as well as cross-border transactions. Yet it is reasonable to assume that the share of related-party revenues is not so very different at the domestic level and the international level. (If anything, the share of related party transactions could be expected to be higher for cross-border revenues, given the incentive for tax avoidance inherent in those.) So perhaps “a third or more” is a better estimate.
The World Bank research paper we mentioned earlier, entitled “Arm’s-Length Trade: A Source of Post-Crisis Trade Weakness,” provided a little more granular detail (AEs means Advanced Economies; EMDEs means emerging market and developing economies,): again, confirming the “third or more” figure, and the rising trend.
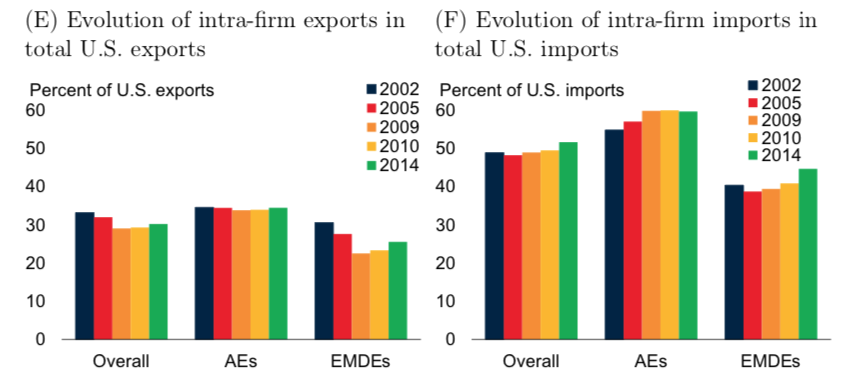
If and when other countries provide public CbCR statistics or data, this would shed more light. Visually, this tells us that about one third of US exports involve intra-firm trade, while about 48 percent of US imports involve intra-firm trade, yielding an average that is about 40 percent, or two fifths. On this evidence, “over a third” seems to be a better estimate than “a third or more.”
If you were apply these ratios – between a third and two fifths – to the total volume of world goods and services trade of about $22.5 trillion in 2018 (according to the WTO) — you would get some $7-9 trillion (or more) in cross-border trade that happens inside multinational corporations.
This multi-trillion dollar figure highlights the potential for illicit financial flows by multinational enterprises engaging in tax avoidance. And it also highlights the need for more public CbCR data.
We’re not alone in asking for this. Momentum is growing for public CbCR. Not least from institutional investors managing $10 trillion in funds, who would also like to know what on earth is going on.
The author

Related articles

UN tax convention hub – updates & resources

Four definitions to change the world: Struggles over meaning in the UN tax convention negotiations

Fiscal hell or mirage? What Spain’s wage debate gets wrong

Introducing the Real Estate Secrecy Index

Indicator deep dive: Golden Visas

The European Court of Human Rights has upheld the weaponisation of privacy to restrict tax authorities’ access to banking data

She cleans your house but the tax system can’t see her

What we learned from three years of conversations on poverty beyond growth
Q&A on California’s proposed legislation on Worldwide Combined Reporting (WWCR)
27 May 2026

California steps up for tax fairness
